Audience
You can use the Audience report data to find out which type of audience the ad campaign has drawn, and how changes to the app affect traffic from a certain region.
The report allows you to pull out certain users by defining data segments.
To build a report, you need to choose the time period, the audience segment, and the grouping type. By default, the report shows the number of active and new users over a one-week period, grouped by date.
Report period
The report is formed for a specific time period. The default period is one week.
To set the report period, use the drop-down element  . The selected time interval can be grouped by hours, days, weeks, or months.
Grouping data
The data in the report can be grouped by:
- Date.
- Country.
- Region.
- City.
- Gender.
- Age.
These types of groupings allow you to assess characteristics of the application's audience.
Metrics
The following metrics are available for analysis:
- Users
- The number of application users for the specified period.
- New users
- The number of new users for the specified period.
- New users share
- The percentage of new users relative to the total number of users.
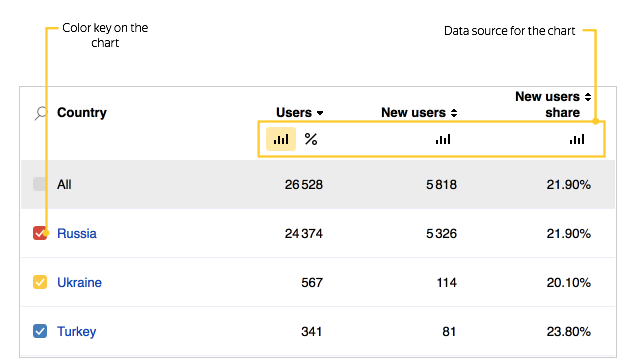
The report interface also displays the following:
- The color key of metrics on the chart. Use it to show or hide a metric on the chart.Note. This item is not displayed when the data is grouped by date.
- The traffic source selection for the chart. Enables you to choose the metric to show on the chart: users, new users or percentage of new users.
Data export
You can export data by choosing an item from the Export dropdown list above the chart. The data is exported based on the selected report settings: segmentation, grouping, and time period.
The dropdown list contains the following elements:
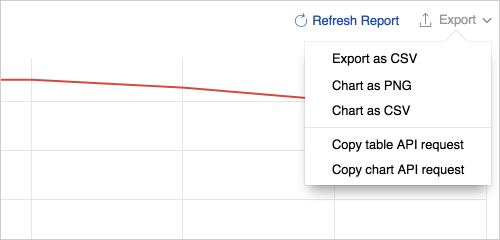
- Export as CSV — Exports the data from the table in the CSV format.
- Chart as PNG — Exports the chart image in the PNG format.
- Chart as CSV — Exports the data from the chart in the CSV format.
- Copy table API request — Displays the query text for exporting data from the table using the Reporting API. You can use this query to build your own dashboard or create automated data export scripts.Note. If you are getting the text of the query for the first time, make sure that the browser doesn't block the pop-up authorization window. In the authorization window, allow AppMetrica to access the data.
- Copy chart API request — Displays the query text for exporting data from the chart using the Reporting API. You can use this query to build your own dashboard or create automated data export scripts.Note. If you are getting the text of the query for the first time, make sure that the browser doesn't block the pop-up authorization window. In the authorization window, allow AppMetrica to access the data.